
Get in touch
By clicking on the button, you agree to the privacy policy


About the company
UI/UX and front-end
for a DevOps software with automated remediation
Shoreline is a DevOps company offering an incident automation platform to software service operators. Shoreline enables customers to monitor their infrastructure in real-time, debug and repair issues across their server fleets, and automate their responses to alarms. As said in one of the InfoQ podcast's episodes, operators use Shoreline to reduce tickets, eliminate manual work, and improve availability.
Product
Every second, Shoreline ingests thousands of metrics, runs hundreds of system health checks, and executes the remediations you have defined.
The debug and repair feature allows users to execute commands in real-time, across their server fleet and without having to SSH into the servers. Users can execute anything that can be typed at the Linux command prompt, including Linux commands, shell scripts, calls to their cloud provider APIs, and Kubernetes.
Users can quickly turn these debug sessions into automation and connect them to alarms. The Shoreline app will automatically execute that automation whenever an alarm is triggered.


Backend team is based in San Francisco, USA.
API is done by a team in Romania. They implement REST API.
UX/UI and frontend is carried out by Aspirity. We had to work with UX/UI design, React/Redux, typescript, highcharts, and build microservices architecture.


What Needed to Be Done
The project was divided into three parts, with all development being carried out in parallel.

How We've Got the Look
We started by researching project management processes from the user's point of view. We have been analyzing similar products. It allowed us to pinpoint specific functions that users expect to see and get references to draw on during the development process.
How We've Got the Look
We started by researching project management processes from the user's point of view. We have been analyzing similar products. It allowed us to pinpoint specific functions that users expect to see and get references to draw on during the development process.
Key Success Factor
Despite the vast geography of the Shoreline Software team, we have built a competent management process and asynchronous work in different time zones.
The daily syncs meetings with all of the teams also came in handy. As well as constant communication and exchange of experience that helped us find a solution for any situation.
The daily syncs meetings with all of the teams also came in handy. As well as constant communication and exchange of experience that helped us find a solution for any situation.
Aspirity is working as an extension of a DevOps startup team to create a web app. The team is utilizing React and Typescript as well as numerous other resources, tools, and technologies for frontend development. They always have a constructive discussion around finding solutions to the problems. Aspirity is a technically capable, experienced, and agile web development company.
Testimonial
Alay Desai
Founding PM at Shoreline Software, Inc
Project Features
6 modules
to rule them all
We used a micro front-end approach and divided the project into 13 independent apps combined into 6 modules. This allows us to build, deploy and load each one of the apps separately. It also helped us increase the loading speed for the user.
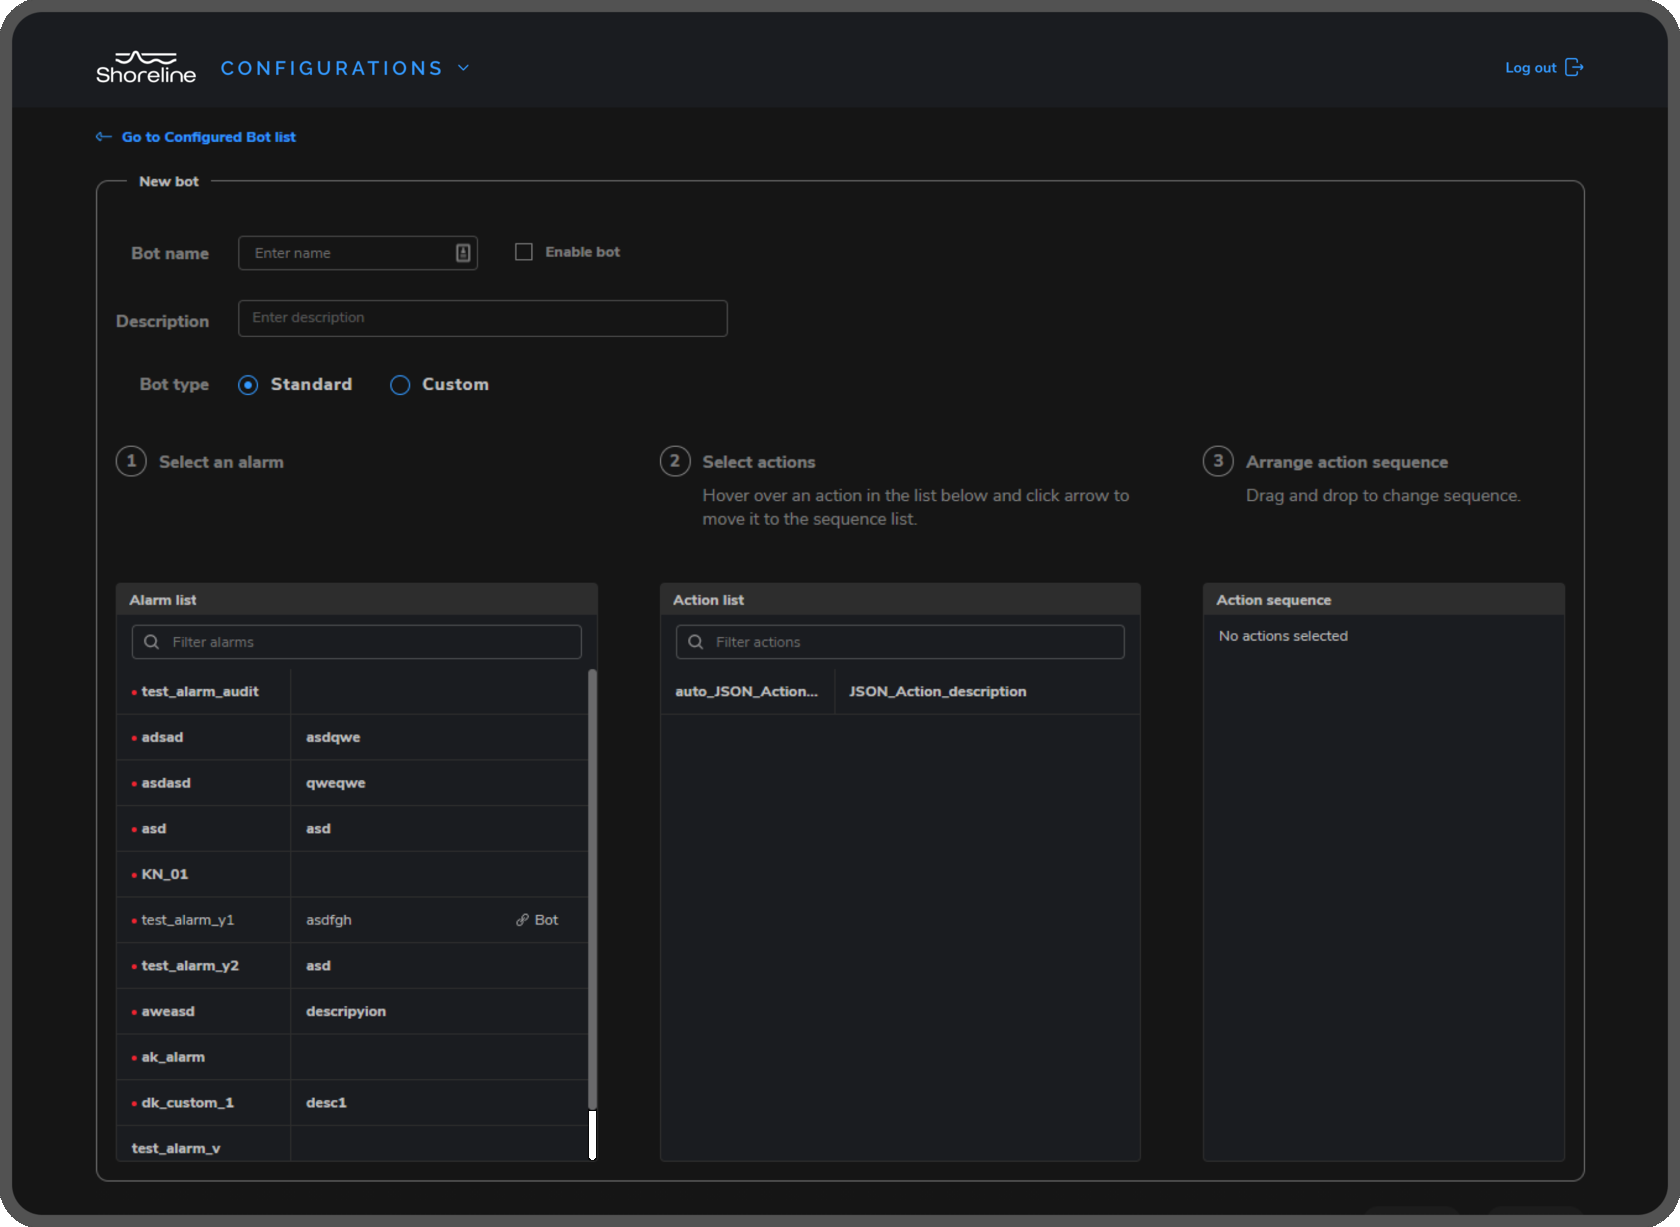
The remediation loop is triggered by status checks called Alarms. The Alarm is raised based on custom thresholds or shell commands set by the user. When this happens the Bot fires all associated and enabled Actions. These Actions execute shell commands on associated Resources. So then an Alarm fires the associated Bot triggers the corresponding Action, closing the auto-remediation loop.
Bots are used to connect Alarms to Actions. Users can create and edit Bots with great detail via a three-step creating system. First, users select a condition that will trigger the Alarm. Then they choose a sequence of Actions from the provided list. And finally, users need to select Actions in a specific order to set the Bot.
Bots are used to connect Alarms to Actions. Users can create and edit Bots with great detail via a three-step creating system. First, users select a condition that will trigger the Alarm. Then they choose a sequence of Actions from the provided list. And finally, users need to select Actions in a specific order to set the Bot.
Remediation loop
We've built a grid that allows users to look at the work process in the context of a specific area and for a specific customer. We used virtualization to display different graphs. We request data and display only those ones that the user can see on the screen. When the user scrolls down, some of the graphs will be deleted from the memory and replaced by others. That helps to maintain a certain number of graphs that the user can interact with. Also, this amount can be configured too and users can apply an overlay, as well as event annotations, to each of the graphs.
We have a large amount of data to dynamically update. So we had to display all the requested historical data correctly. One of the solutions for this was the zoom of the desired area. It allows users to look at detailed data with a 1-second resolution.
Graphs. A lot of Graphs
Zoom

Users can set a threshold that shows us how the metric has been changing over time. Or they can set a band and check how the metric has changed within it. Our overlays work on the Y-axis. It gives users a chance to choose how they want to aggregate a rollup of data. The options are percentiles, minimum, average, or maximum. Users can also select the desired period, change the metrics and resources from which these metrics are taken, change the chart type and choose how many columns will be used to display the graphs.
Overlays
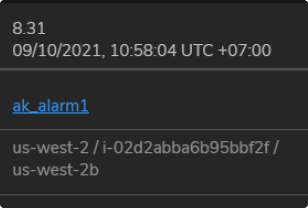
Annotations are used for the occurring alarms. They are placed on a chart depending on the certain point in time and on a specific resource where they happened. The alarms can be queried and displayed on a chart providing data about the time period and affected resources.
Annotations (Alarms)
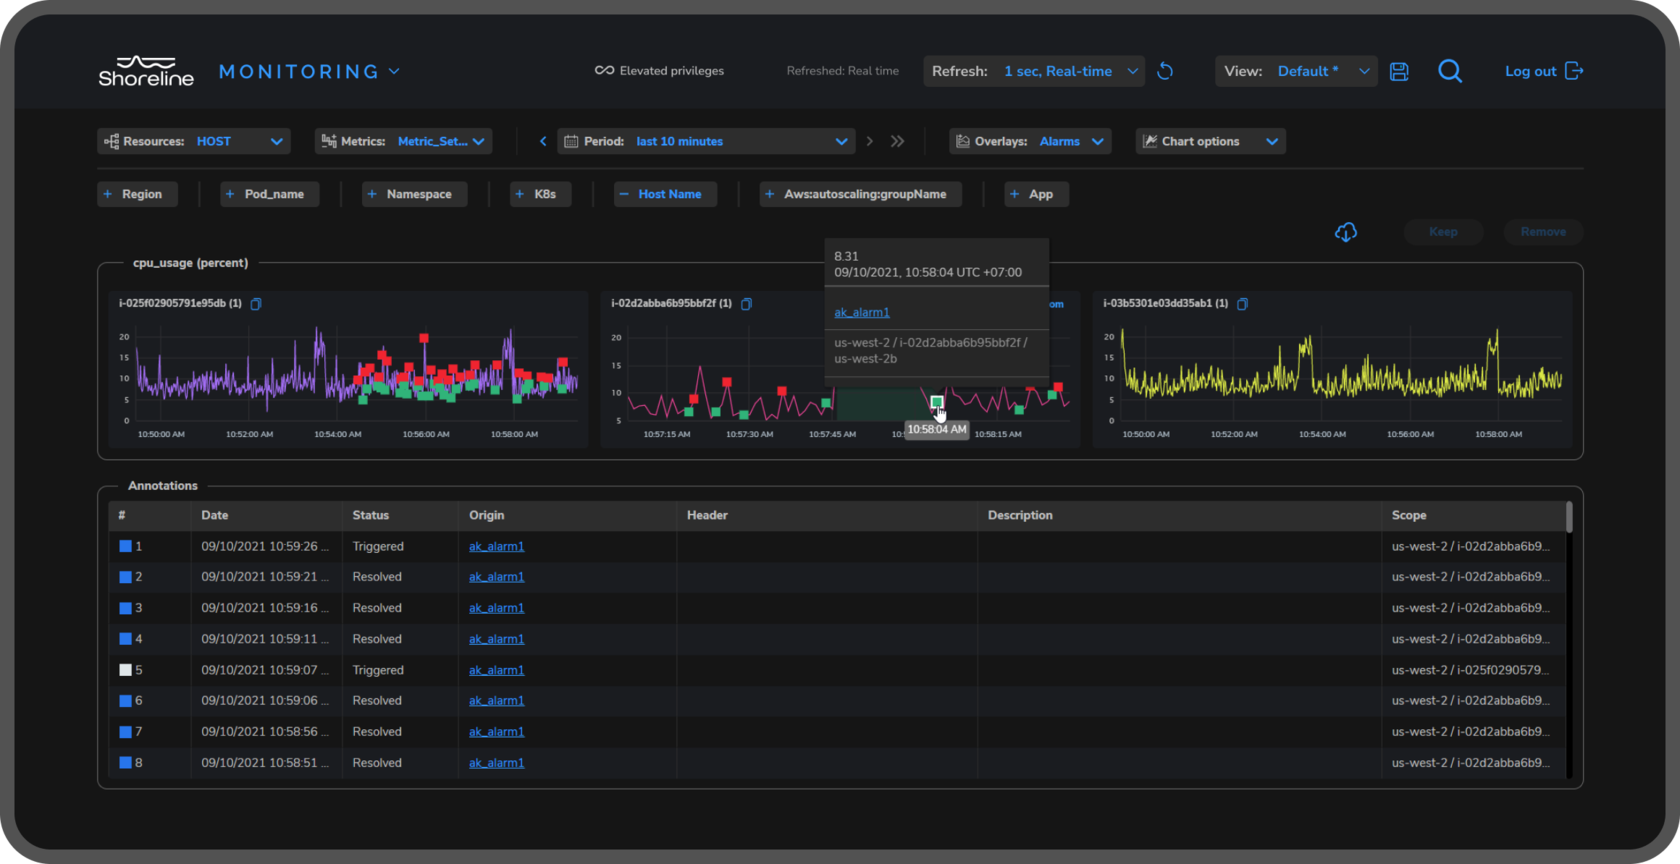
Annotations are used for the occurring alarms. They are placed on a chart depending on the certain point in time and on a specific resource where they happened. The alarms can be queried and displayed on a chart providing data about the time period and affected resources.
Annotations (Alarms)
We developed a logic and optimization system for the project. So that the site works with large amounts of data and a lot of dynamic graphs. All charts with annotations and overlays update in real-time. And any change is displayed in a second.
For the service to work without any lag, we use caching and data prefetching. It helps users to get the real picture almost immediately without spinners.
For the service to work without any lag, we use caching and data prefetching. It helps users to get the real picture almost immediately without spinners.
React/Redux, React Query, Typescript, Highcharts, micro frontends architecture, OpLang, REST API, Material UI, Figma
Stack
Flawless Performance


If you want something similar or have
an amazing idea
Just drop us a line
and we will be happy to work with you!
and we will be happy to work with you!
Team
- Ivan GrischenkoTech Lead
- Anna KazantsevaPM + QA
- Vladimir FominSenior Developer
- Evgeny GrininSenior Developer
- Konstantin NosarevMiddle Developer
- Viacheslav BurykhMiddle Developer
- Vladislav KhayretdinovMiddle Developer
- Dmitrii TikhvinskiiJunior Developer
- Sergey KraskovQA (automation)
- Yurii SindyashkinQA Middle
- Dmitrii KosenkovQA Junior
- Maria DemeshevaUX/UI Designer
Team
- Ivan GrischenkoTech Lead
- Anna KazantsevaPM + QA
- Vladimir FominSenior Developer
- Evgeny GrininSenior Developer
- Konstantin NosarevMiddle Developer
- Viacheslav BurykhMiddle Developer
- Vladislav KhayretdinovJunior Developer
- Dmitrii TikhvinskiiJunior Developer
- Sergey KraskovQA (automation)
- Yurii SindyashkinQA Middle
- Dmitrii KosenkovQA Junior
- Maria DemeshevaUX/UI Designer
Best Laid Plans
- Light mode
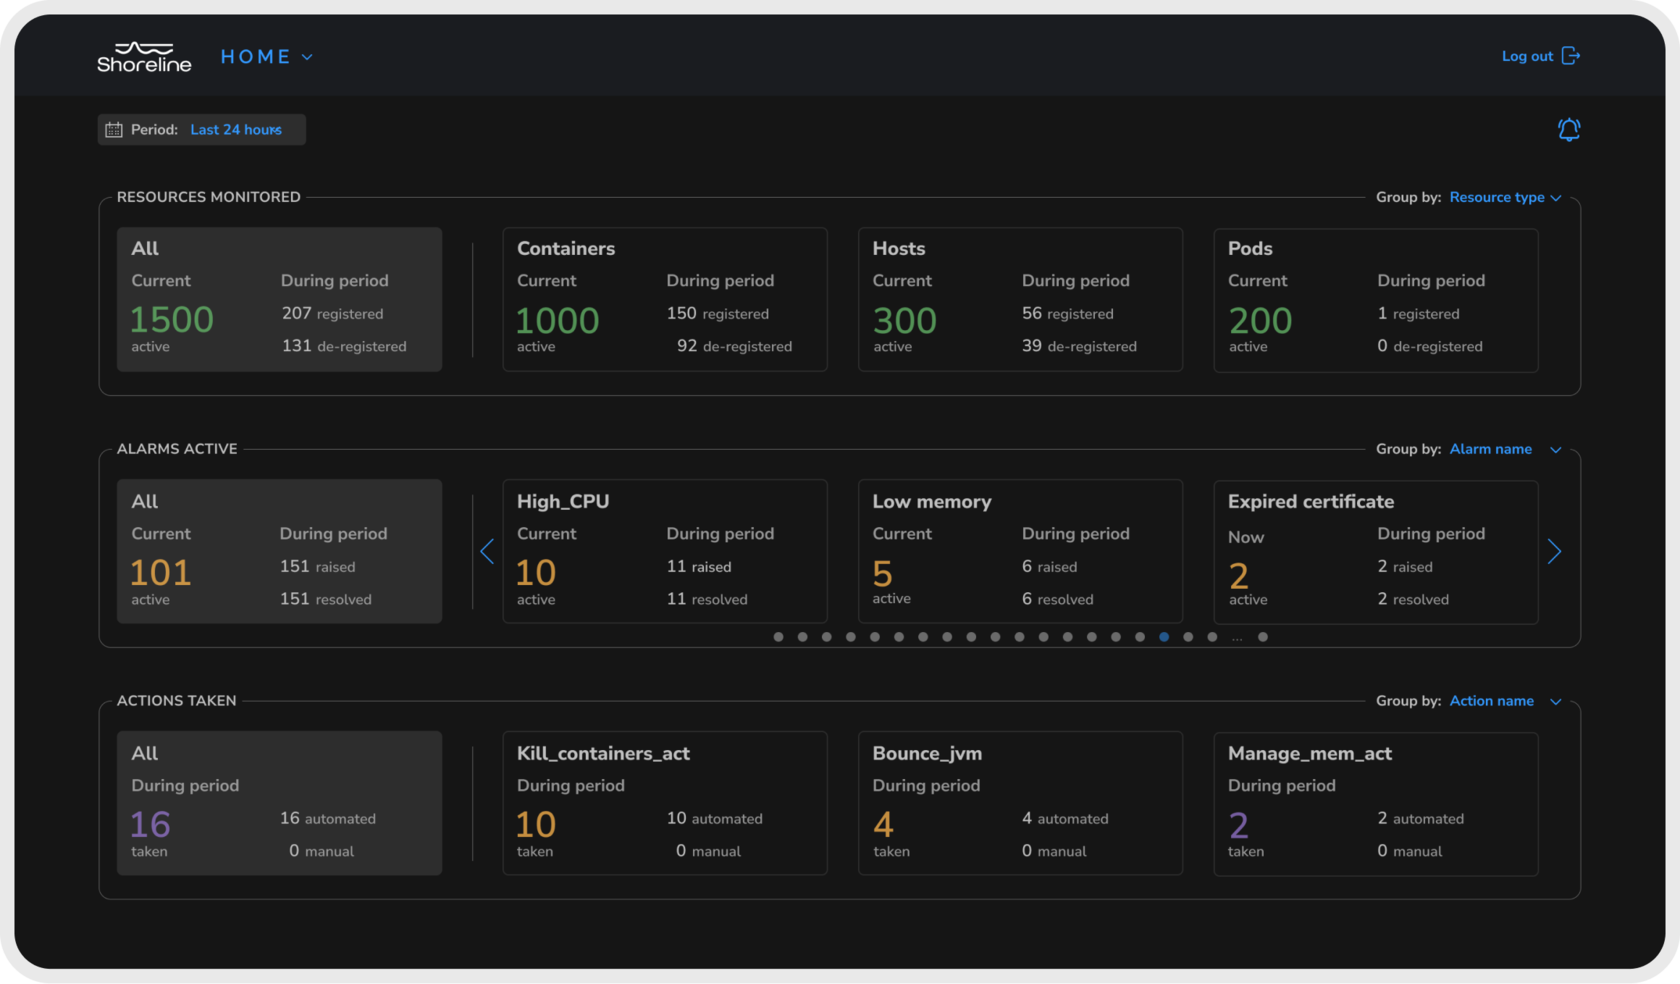
- Dashboard with general statistics on system resources, metrics, a list of hot spots and other small charts
- Modules for user and account management
- Improve existing features
- Notebooks module (inspired by Jupyter) with syntax highlighting and autocomplete on OpLang
...and something more.
Best Laid Plans
- Light mode
- Dashboard with general statistics on system resources, metrics, a list of hot spots and other small charts
- Modules for user and account management
- Improve existing features
- Notebooks module (inspired by Jupyter) with syntax highlighting and autocomplete on OpLang
...and something more.